The Hidden Connection: How Newsletter Analytics Reveal What Families Actually Want

TL;DR
Stop guessing what families want. Your newsletter analytics already tell you! Schools using data-driven communication strategies see higher open rates and measurable improvements in parent participation. Three key insights: families spend 4-5 minutes reading well-designed newsletters (vs. 90 seconds for typical emails), attendance-related content drives the highest engagement, and 78% read on mobile.
When Elizabeth Power at Westside Community Schools looks at her newsletter analytics, she sees something most educators miss: a roadmap to what families actually care about.
“At any point, I can jump into the platform to see what has been sent, what’s being sent, and what’s scheduled,” Power explains. “It cuts out the gray area.” But more importantly, those analytics tell her which topics spark real engagement and which messages fall flat.
This is about creating better relationships through strategic communication. And the data shows us exactly how to do it.
The Analytics That Actually Matter for Family Engagement
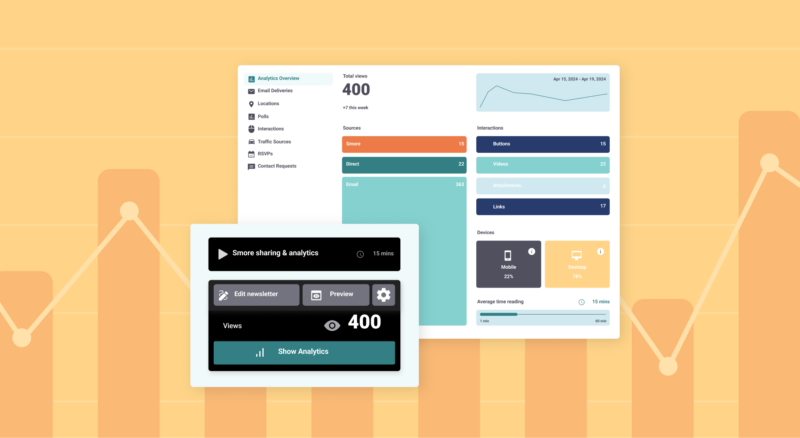
Most schools track open rates and call it a day. But the districts seeing real improvements in family engagement dig deeper into three specific metrics:
1. Time Spent Reading (Not Just Opening)
Gates Chili Central School District discovered their families were spending an average of 4-5 minutes reading newsletters—far longer than typical email engagement. This told them something crucial: when information is packaged thoughtfully, families will invest time in it.
What this means for you: If your average read time is under 90 seconds, your content might be too dense or not visually engaging enough.
2. Click-Through Patterns by Topic
Westside Community Schools found that attendance-related content consistently drove the highest engagement, followed by academic updates, then extracurricular activities. This insight completely shifted their communication strategy.
What this means for you: Your most-clicked topics reveal your community’s priorities. Double down on those themes.
3. Device Usage Data
Over 78% of parents read school newsletters on mobile devices, according to Smore’s aggregate data. Yet many schools still design desktop-first communications.
What this means for you: Mobile-first design isn’t optional—it’s essential for engagement.
Three Data-Driven Strategies That Actually Work
Strategy 1: The “Curiosity Gap” Approach
Instead of: “Important Updates from the Principal’s Office” Try: “The One Change That’s Already Improving Student Outcomes”
Rochelle Santos from Framingham Public Schools saw 40% higher open rates when she started writing subject lines that created curiosity rather than just stating facts.
Strategy 2: The “Community Mirror” Method
Use your analytics to reflect your community back to itself. If sports content gets high engagement, lead with student athlete spotlights. If academic content resonates, feature classroom innovations.
Strategy 3: The “Response Loop” System
When families engage with content, create opportunities for them to engage further. Track which topics generate the most clicks and build on those themes in future communications.
The Trust Factor: When Newsletters Become Relationships
Gates Chili Central School District serves 4,000 students with 12% English language learners. When they adopted Smore, Communications Director Iva Petrosino focused on two things: consistent scheduling and accessibility. “We plan our superintendent’s messages and other stories for the month. It’s invaluable to see the year at a glance,” she explains.
Westside Community Schools took a different approach. With over 6,200 students, Director Elizabeth Power emphasizes brand consistency across grade levels. “When your student starts as a kindergartner, you know exactly what that newsletter is going to look like. Then they go into middle school, and while so much changes, one thing stays consistent—our newsletters.”
Both districts report measurable increases in engagement, but the paths that got them there were tailored to their specific communities.
Your Next Steps: From Data to Connection
- Audit your last 5 newsletters: What topics got the most engagement? What patterns do you see?
- Test one new approach: Pick either the curiosity gap headlines or the community mirror method for your next newsletter.
- Set up meaningful metrics: Track read time and click-through rates by topic, not just overall opens.
- Create a feedback loop: Ask families directly what they want to hear about, then cross-reference with your analytics.
Effective school communication creates ongoing dialogue with families. Those conversations start with understanding what your community actually wants to hear.
Ready to transform your school communications? Learn how Smore’s analytics can help you build stronger family relationships through data-driven insights.
Frequently Asked Questions
How can newsletters improve family engagement?
What are best practices for school-home communication?
How do I measure newsletter effectiveness?