Smore Analytics: Numbers You Can Count On

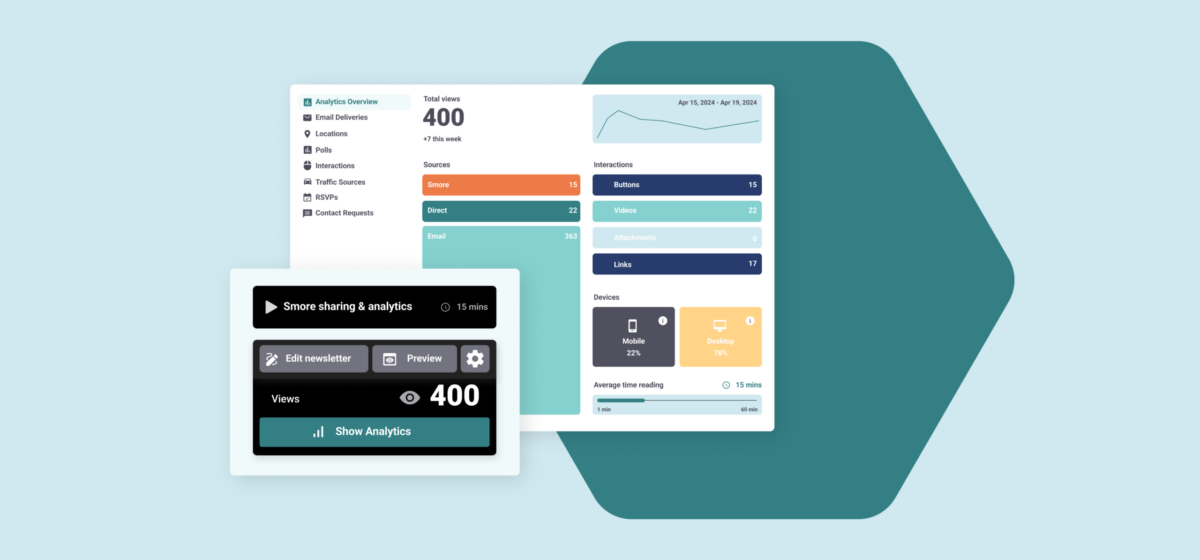
👋 Say hello to Smore Analytics! Smore Analytics provides an easy way to determine what happens to your newsletter after you hit “Publish.” Plus, it provides you with easy insights that can help you make more informed decisions about your content, and engage the people who matter to you.
Who’s Reading My Emails
If you emailed your newsletter using Smore, you have some pretty powerful tools at your fingertips. Open up your Analytics dashboard, and click the “Email Report” tab. Here’s what you can do:
👩 See a list of who received your newsletter → Who’s loving what you’re throwing down
📬 If/when they opened it + how many times they opened it → determine optimal send times.
🖱 Know whether or not they clicked on your newsletter. → Who are your real fans?
It’s a simple way to know how your audience is engaging with your content.
If you bounce over to the Metrics tab ⬆️ , you’ll also see a “Time Spent” graph, where you can get a sense of how long your audience spends interacting with your newsletter. For example, if you mouse over a given bar in the graph, you can even see how many recipients spent, say, ten minutes engaging with your content. It’s a great way to understand how your content resonates with your audience.
✨ Pro benefit:
Free users can view a total of five emails in their email report. Pro users get unlimited access to their email stats!
How’d You Find Me?!
In the Metrics tab of your analytics Dashboard, you can see where your traffic originates. Here, you’ll be able to see whether or not folks are reaching your content via email, Facebook, and Twitter, or if they’re coming directly to your link.
📈 Use Metrics data to figure out the best places to post your content. Facebook? Twitter? Carrier pigeon?
📰 Look at metrics for multiple newsletters to determine what kind of newsletters work in which locations
✨ Pro benefit:
Export your data into an Excel file, which you can use with CRM software like Hubspot or Zoho, or for other biz dev objectives.
Goals: See What’s Clicking
Let’s say you run Steve’s Scented Candle Emporium and send out a monthly “Here’s What’s New” email to your customers. You’ll probably want to know if folks prefer “Lavendar Lane” or “Teen Spirit.” With Goals, it’s easy to see what’s clicking. Literally.
👇👇👇👇👇👇👇👇👇👇👇👇👇👇👇👇👇👇👇👇👇👇👇👇
🔗See how many times links are clicked. Figure out what content your audience likes.
📆 See if recipients have RSVP’d to a given event. Useful if you run a yoga studio or host competitive basket weaving tournaments.
💼 Make better marketing, product, and biz dev decisions, based on which links are popular, and how many folks RSVP to which events.
Location, Location, Location
As any brick-and-mortar store can yell you, an important factor in business is location. That’s why Smore helps you see where your audience is viewing your newsletter. Clicking the “Location” tab allows you to see a nifty map of locations where your newsletter has been opened.
🗺 See where your audience is
🗾 See how many people view your content in each location
🕵️♀️ Find patterns. Getting a lot of views from warm climates? A particular city? Near a specific event?
✨ Pro benefit:
Free users need 30 views before unlocking analytics. Pro users get immediate access!
Subscribe to Smore Blog
Get the latest posts delivered right to your inbox


