The resources in this newsletter are in addition to those found in MODULE 2: Oceanography as Science of your course content. You should first go through the content and complete the quizzes and activities. These resources are to supplement your understanding of the concepts. Please contact me if you have questions!
ASSIGNMENT RESOURCES AND TIPS
Assignment: Experimental Design
The instructions for this assignment are on page 5 of the module.
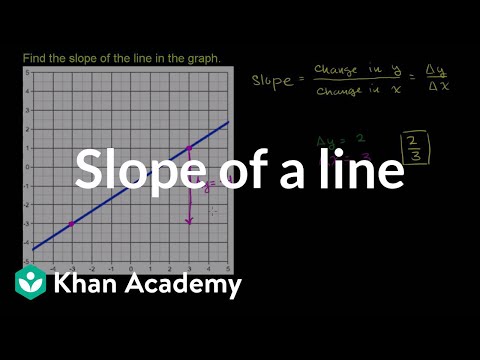
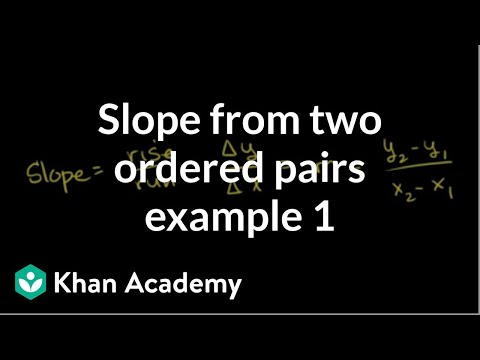
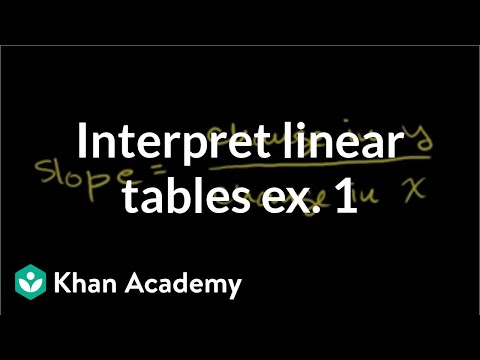
When creating your graph for the Density and Temperature Experiment, refer to this video for help in creating a graph: https://youtu.be/6B3z-e4h04Y
Labeling Axes: Remember, your x-axis is the independent variable and the y-axis is the dependent. This means that the quantity on the y-axis DEPENDS on the quantity on the x-axis. So, the number of trials or number of flips should be on the x-axis because they DETERMINE the number on the y-axis.
There is a video in the module that shows you how to create a graph using Excel.
Here is a PDF of the document I was working on in the video in case you want to reference my notes.
When answering question 1-3 on both parts, use the images below as a guide:
Experimental Design Assignment
Lab: Sink or Float
The instructions for this assignment are on page 5 of the module.
This lab requires a LAB REPORT. Please review the How to Make a Lab Report video on page 4 of the module.
This video also helps describe how to make a lab report.
This video will walk you through the lab and what you should have in your lab report for this specific lab (embedded below).
The Word document that has the template for your lab report that I use in my walkthrough video can be found HERE.
Do not forget to cite your sources. If the source comes from the internet, you must provide a link to the page where you found the information used in your project. For example "Google.com" is not an acceptable "link" to a source. "https://en.wikipedia.org/wiki/Ocean" is acceptable, as it takes you directly to a page (see the end of the video embedded below for more clarification on this).
Q: I was just wondering if i could see an example of a lab report. I'm just a bit confused on formatting and such.
Q: Do the components of the experimental design (independents variable, dependent variable, control, etc.) go under the introduction or Materials and Procedures?
A: As per the rubric in the dropbox folder for the assignment, you should put your variables in the materials and procedures section.
Q: Should I include both a null and alternative hypothesis? I don't understand the difference.
A: You should only use a null and alternative hypothesis if you are doing statistics. If you aren't running statistics on your data, then you will simply use a traditional "if...then" hypothesis.
Q: Should the procedure be listed in paragraph form or numbered?
A: You can do whatever you want. It should be detailed enough for someone else to follow the instructions, but should expect your reader to be an intelligent, science-minded person. For example, you don't need to tell the reader to get a piece of paper or pencil to collect their data. You would assume they know to do basic things like that.
Sink or Float Lab
Project: Scientific Name Formation - NOT GRADED
The instructions for this assignment are on page 5 of the module.
This project is a test grade, so it is worth 30% of your course grade.
Discussion: Experimental Failure?
Most scientists will tell you that no experiment is a failure. How can they make such a claim? Why do scientists further suggest the experimenters indicate their hypothesis as supported or not supported rather than proven or correct? Respond to this question and at least two other students for full credit. Use specific examples in each response.
Use the RUBRIC to help you write a discussion posting that will earn full points.
You MUST respond to two classmates with responses that are AT LEAST 3 sentences in order to earn full credit. "I agree with..." or "I disagree with..." is not enough to earn full points for a response. You must say why you agree or disagree and back up your reasoning.
Assignment: Scientific Method Review
The instructions for this assignment are on page 5 of the module.
Q: I can't see the pictures at the bottom of the assignment. What should I do?
A: The document for the assignment must be opened in Word. All GAVS accounts come with free Office software. If you haven't downloaded it, this video will show you how to download O365:
How to Download O365 Apps. You can download it on your tablet(s), phone, and computers. This will ensure that you will be able to see all assignments in the course clearly and give you access to software you can use even after the course closes. Here is a copy of the assignment as a PDF: Scientific Method Review
Q: What is a concept map?
A: A concept map is something that usually has a main topic in the center and then related topics branch out from the main topic, connected by an arrow or a line. That part of the assignment is looking to see if you understand how these terms are related to one another. You can draw your concept map by hand and attach it or make it on the computer. Students have used PowerPoint and Word successfully to make their concept maps in the past.


