


Empirical Rule explination
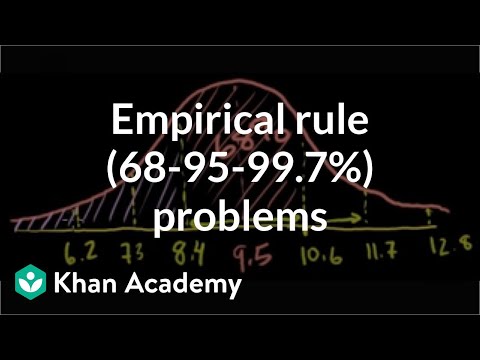
- Above the mean, the empirical rule or the 68-95-99.7 rule. tells us that there is a 99.7% chance of finding a result in a. normal distribution that is within three standard. deviations of the mean.
- When do we use the empirical rule? The Empirical Rule is often used in statistics for forecasting, especially when obtaining the right data is difficult or impossible to get. The rule can give you a rough estimate of what your data collection might look like if you were able to survey the entire population.
- Example 68% of data falls within the first standard deviation from the mean.
- 95% fall within two standard deviations.
- 99.7% fall within three standard deviations

Control Chart
The control chart is a graph used to study how a process changes over time. Data are plotted in time order. A control chart always has a central line for the average, an upper line for the upper control limit and a lower line for the lower control limit. These lines are determined from historical data

Z-Scores- Calculation
- The z value or z score (also known as standard score) gives the number of standard deviations between the original measurements x and he mean of the x distribution
- The mean of the original distribution is always zero, in standard units. This is understandable because the mean is zero standard variations for itself.
- an x value is the original distribution that is above the mean u has a corresponding z value that is positive.