In this lesson you will learn how to informally compare two populations by using the range and interquartile range.
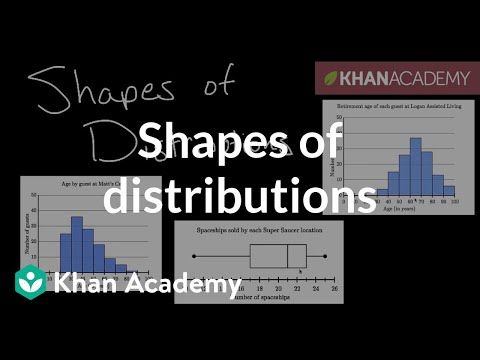
Some distributions are symmetrical, with data evenly distributed about the mean. Other distributions are "skewed," with data tending to the left or right of the mean. We sometimes say that skewed distributions have "tails."
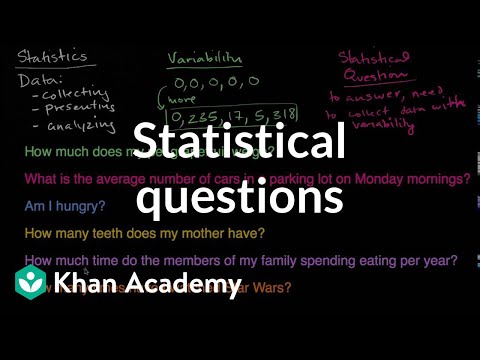
What makes a question a "statistical question"?
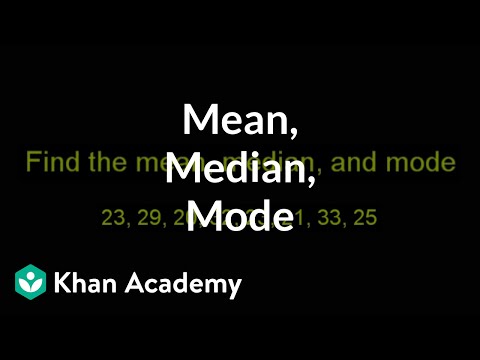
Here we give you a set of numbers and then ask you to find the mean, median, and mode. It's your first opportunity to practice with us!
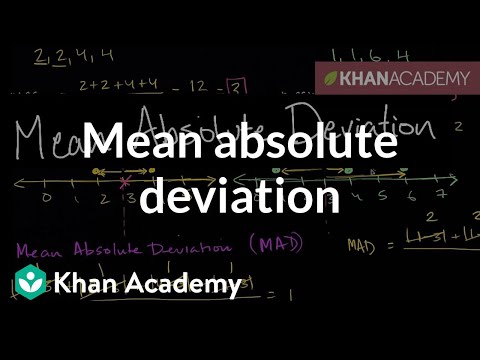
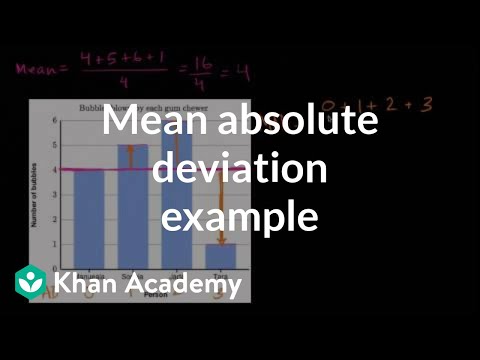
MAD (mean absolute deviation) helps you get a sense of how "spread out" a data set is. Learn how to compute MAD in this video.
Sal finds the mean absolute deviation of a data set that's given in a bar chart.
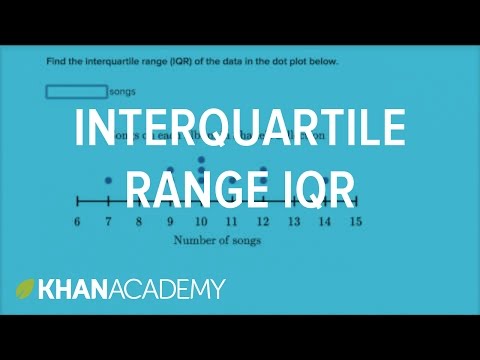
Learn how to calculate the interquartile range, which is a measure of the spread of data in a data set.
Here's a word problem that's perfectly suited for a box and whiskers plot to help analyze data. Let's construct one together, shall we?
Thursday night's homework: This is a really short video. It is a song, not a bunch of worked out examples, but make sure you take some...
Homework due 11/12/15--Watch BOTH videos below
How to write expressions with variables and parentheses