
Nicholson- AP MACRO REVIEW
Measurement of Economic Performance
12-16% Measurement of Economic Performance
A. National income accounts
1. Circular flow
2. Gross domestic product
3 . Components of gross domestic product
4. Real versus nominal gross domestic product
B. Inflation measurement and adjustment
1. Price indices
2. Nominal and real values
3. Costs of inflation
C. Unemployment
1. Definition and measurement
2. Types of unemployment
3. Natural rate of unemployment
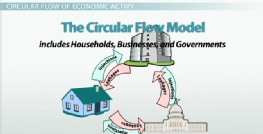
Circular Flow of Economic Activity
•Households supply resources (land, labor, capital, entrepreneurial ability) to the resource market. Households demand goods and services from businesses.
•Businesses demand household resources and supply goods and services to the product (factor) market.


GROSS DOMESTIC PRODUCT
Expenditure Approach
GDP (Gross Domestic Product): The total dollar (market) value of all final goods and services produced in a given year.
Expenditures approach: GDP = C + Ig + G + Xn
C = personal consumption expenditures (durable consumer goods, nondurable
consumer goods, consumer expenditures for services)
Ig = gross private domestic investment (all final purchases of capital by businesses, all
construction, changes in inventories)
G = government purchases (government spending on products and resources)
Xn = net exports (exports – imports)
Some types of transactions do not involve purchasing of a final good or service, so they
should not be counted in GDP. These include public transfer payments (social
security, welfare, etc), private transfer payments (monetary gifts, etc), security
transactions (stocks and bonds), and secondhand sales (they don’t reflect current production)
GDP: What Counts:
•Goods Produced but not Sold (I)
•Goods produced by a foreign country (Japan) in the U.S. (Honda, Toyota)
•Government spending on the military
•Increase in business inventories
GDP: What DOES NOT count:
•Intermediate Goods (Tires sold by Firestone to Ford)
•Used Goods
•Non-Market Activities (Illegal, Underground)
•Transfer Payments (Social Security)
•Stock Transactions
Income Approach
GDP = Compensation of employees + Rents + Interest + Proprietors’ income +
Corporate profits (Corporate income taxes + dividends + undistributed corporate
profits) + indirect business taxes + depreciation (consumption of fixed capital) + net
foreign factor income
PI Personal Income includes all income received, whether earned or unearned.
DI This is the amount of money households can spend. It is PI minus personal taxes.
Real and Nominal GDP
•Nominal GDP: GDP measured in terms of current Price Level at the time of measurement. (Unadjusted for inflation)
•Real GDP: GDP adjusted for inflation; GDP in a year divided by a GDP deflator (Price Index) for that year
Real GDP= Nominal GDP adjusted for inflation.
Calculation:
Real GDP = Nominal GDP
Price Index in Hundredths( deflator)
Example:
U.S. 2005 Real GDP= $12,4558 (billions)
1.1274 (based on 2000)
$11.048 Trillion
Shortcomings of GDP
•Nonmarket activities: (services of homemakers) does not count.
•Leisure: Does not include the value of leisure.
•Does not include improvements in product quality.
•Underground economy
Real GDP Per Capita
•Most commonly used to compare and measure each country’s standard of living and overall economic growth.
• CALCULATION :Real GDP/Nation’s Population
GDP Gap
This is the amount by which actual GDP falls short of potential GDP (the GDP that can
be attained at the natural rate of unemployment).
Economic Growth
The economic growth rate is calculated with the formula
Economic Growth:
GDP new - GDP old
GDP old * 100
If the growth rate is between 2-4%, it is considered “acceptable”.
Business Cycle
Business Cycles
•The increases and decreases in Real GDP consisting of four phases:
•Peak: highest point of Real GDP
•Recession: Real GDP declining for 6 months
•Trough: lowest point of Real GDP
•Recovery: Real GDP increasing (trough to peak)
Peak -- Greatest spending and lowest unemployment. Inflation becomes a problem.
Contraction/Recession -- Reduction of spending levels and increasing unemployment. Some cyclical unemployment begins.
Trough -- Least spending and highest unemployment
Expansion -- Spending increases and unemployment decreases
We want to avoid extreme inflation and extreme unemployment. We want stability!
Inflation
Consumer Price Index
Inflation is a rise in the general level of prices
•Reduces the purchasing power of money
•Measured with the Consumer Price Index (CPI)
•Reports the price of a market basket , more than 300 goods that are typically purchased by an urban household
Calculations for CPI and Inflation
This is a measure of inflation. It is calculated by the formula
CPI = price in specific year/price in base year * 100
Calulating Inflation:
Calulating Inflation:CPI in Recent Year – CPI in Past Year
Divided by CPI in Past Year
(Number then Multiplied by 100)
Example: 2002 CPI = 179.9
2001 CPI = 177.1
Rate of Inflation: 179.9-177.1 = 1.58%
177.1
Types of Inflation
•Demand Pull Inflation: ‘too much money chasing too few goods.”
•AD Curve will shift to the right, resulting in a higher Price Level and greater Output (until reaching Y*
•Cost-Push Inflation: Major cause is a supply shock-OPEC cutting back on oil production
•AS Curve will shift to the left resulting in a higher Price Level and a decrease in Real GDP.
Demand Pull Inflation

Cost Push Inflation
* Cost Push Inflation - occurs when short run AS shifts left
- the Government could respond by increasing AD (shift AD right) and create a new equilibrium
or
- the Government could allow a recession to occur shifting the AS to the left
- if the Government allows a recession to occur; nominal wages fall and AS returns to its original location

Rule of 70
If we divide 70 by the annual rate of inflation, this quotient is the number of years it
takes for inflation to double the price level.
Fighting inflation
We can fight inflation by trying to reduce demand or by trying to prevent a wage-price
spiral from getting out of hand. We can use either fiscal or monetary policy (means of
doing so is explained later). Fiscal action will result in a budget surplus.
Real and Nominal Terms
NOMINAL INCOME: number of dollars received by an individual or group for its resources during some period of time
REAL INCOME: amount of goods and services which can be purchased with nominal income during some period of time; nominal income adjusted for inflation
Real Income = Nominal Income/Price Index (Hundredths)
•Real Interest Rate = Nominal Interest Rate – Inflation Rate
•Nominal Interest Rate = Real Interest Rate + Inflation Premium
(anticipated inflation)
Inflation: Winners & Losers
•Winners:
•Debtors who borrow money that will be repaid with “cheap” dollars.
•Those who have anticipated inflation
•Losers:
•Savers (especially savings accounts)
•Creditors (Banks will be repaid with those “cheap” dollars
•Fixed-Income Recipients (retirees receiving the same monthly pension)
Inflationary expectations
The effects of unexpected inflation are:
It hurts people with fixed nominal incomes, since the money they earn isn’t worth as
much anymore. It hurts people who save in fixed-value accounts It benefits debtors
(borrowers) while hurting creditors (lenders).
The effects of inflation can be lessened if people expect it (anticipated inflation), since
then they can get a chance to prepare for the damages that the inflation may cause.
For example, a person who has a fixed nominal income can try to adjust it if they know
that its value is going to decrease. Many unions have labor contracts with cost-ofliving
adjustment (COLA) clauses, in which workers’ wages increase if there is
inflation.
Unemployment
•Calculation: Number of Unemployed/Labor Force((Multiplied by 100 to put as a %)
The Labor Force is the total of employed and unemployed workers.
U.S. unemployment should be about 5%
Employed
You are considered to be employed if:
•You work for 1 hour as a paid employee (so part-time workers count)
•You are temporarily absent from work (illness, strike, vacation)
•You work 15 hours or more as an unpaid worker (family farms are common)
Unemployed
•Must be looking for work (at least 1 attempt in the past 4 weeks)
•Are reporting to a job within 30 days
•Are temporarily laid off from their job
Not In Labor Force
A person who is not looking for work:
•Full-time students
•Stay at home parents
•Discouraged workers: those who have given up hope of finding a job.
•Retirees
Types of Unemployment
•Frictional - temporary and unavoidable
•Structural - results from changes in technology or a business restructure (ex. Merger)
•Seasonal- occurs when industries slow or shut down for a season
•Cyclical - results from a decline in the business cycle.

Natural Rate of Unemployment
100% of the people will never be employed, so the government considers 4-6% unemployment to be “full employment.”
We can never be at Full Employment if there is any percentage cyclically unemployed.
Okun’s Law
For every 1 percentage point that the actual unemployment rate exceeds the natural
rate, a GDP gap of about 2% occurs.
For example, if the actual rate is 6% and the natural rate is 4%, there will be a GDP
gap of 4%.

Short - Run Phillips Curve
•Suggests an inverse relationship between the inflation rate and the unemployment rate.
- When the Unemployment rate is high, inflation will likely be low.
- When the Government fights unemployment, typically higher inflation will result. When the Government fights inflation, typically, more unemployment will result. Thereby, we move along the Short-Run Phillips Curve. (Changes in AD = movements on the SRPC.
- The Short-Run Phillips curve can also shift, this would mean that both the unemployment rate and inflation rate are changing at the same time. (A change in AS)
- The Short-Run Phillips curve can also shift, this would mean that both the unemployment rate and inflation rate are changing at the same time.


Long-Run Phillips Curve
•The Long-Run Phillips Curve is vertical, like the Long Run Aggregate Supply Curve. So, in the long run there is no tradeoff between inflation and unemployment. Only the Price Level will change.
